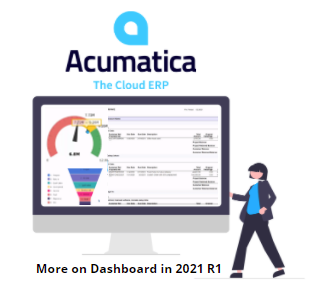
 In a previous article we explained what the new link and meter tiles are in 2021 R1. The new tiles are intended to make data more visible and accessible. What is behind these tiles are data from other parts of Acumatica. For instance, the information tied to each link are sourced from either workspaces or forms such as reports/generic inquires. With meter tiles / KPI meters you can set the properties by selecting from several pre-defined filter settings. Also, in 2021 R1, Acumatica now lets you sort data using a funnel chart. This is simply achieved by selecting a new chart from the dashboard and choosing the chart type funnel, which is sorted and configured by opening the hood in filter settings.